Azure Data Factory
An integrated system to set up and manage global pipelines and hybrid deployments.

The Traffic Analytics Map View keeps Enterprise Big Data users informed about
how their queries and data deployments are performing in all worldwide regions.
Contribution
I contributed visual design visual development to many of the major components of Azure Data Factory.
I was involved from concept through launch. I also designed the team’s collateral materials and website.
Collaborators
PM, Test, Research, Engineering, Database Architects, Migration/Hybrid Cloud/ETL Specialists.
Development
Conceptual documents
The goal of high-level documentation is to capture fundamental concepts. Azure Data Factory is a complex and multi-faceted service, so time had to be invested to fully map out and understand Personas. The following diagram illustrates the User Journey through Data Factory.

Sketches & Brainstorming
I designed Iconography and Visual Language for Azure Data Factory, experimenting with various types of symbolic communication for technical actions. Once a conceptual direction has been established, rough sketches like these would be worked up into polished graphics for integration into a full visual system.

Design Guides
Once the Design is set, the vision can be communicated to various teams. Design Guides empower those teams with the tools and resources they need to help them build better, faster, more accurate extensions of this new visual concept. Below is a sample “UI Toolkit,” a Design Guide for developers.
Wireframes
Once the Design direction is solid, User Scenarios can be created to refine and perfect the interaction model.
Below are some wireframes created to illustrate user interaction with the Azure Data Factory UI Shell.


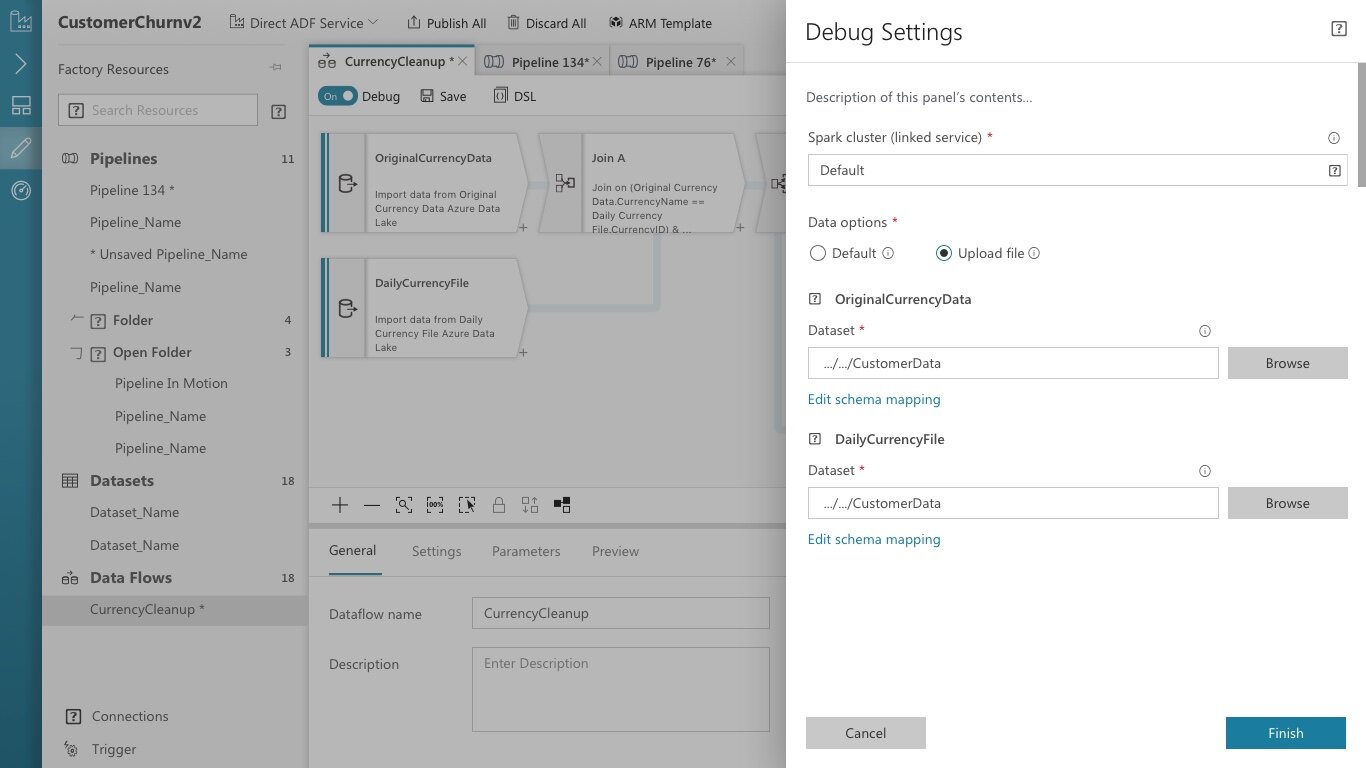
Visual Design
Here is the final design Azure Data Factory design, which shipped globally across all Azure regions.